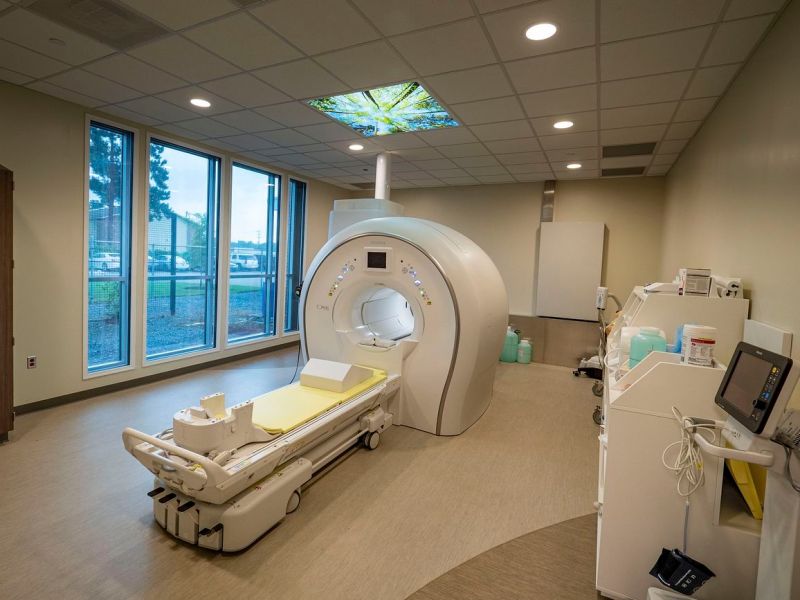
A collaboration I’m involved in has just been published [1]. It’s about a special kind of MRI focused on the chemical element sodium, using meta-analysis to combine estimates form different studies in different brain regions. So what’s the fuss about?
Sodium: Why are we interested?
Sodium (23Na) is an essential mineral that has a number of important biological functions. For neurons in particular, it is important to maintain a difference in the concentration of sodium inside the cell compared to outside.
This concentration ‘gradient’ powers transport of ions, neurotransmitters and nutrients across the cell membrane:

It helps regulates the forces on the cell:

And the distribution sodium is one of the preconditions for generating and maintaining action potentials: the electrical impulses that are a major mode of communication in the nervous system.

Maintaining the ‘electrochemical’ gradient of sodium across the membrane of neurons takes a lot of energy. The brain in general is a very hungry organ: despite representing about 2% of body weight, it accounts for up 20% of energy consumed. Stated differently, that’s a factor of ten more than we would predict on the basis of weight alone [5]. It’s thought that the largest portion of that energy is going towards maintaining the ion gradients, including those involving sodium. This means measuring sodium in the brain could potentially be an indicator of metabolic health – when everything is functioning as it should. Alternatively, it might be a useful indicator of pathology when the normal sodium distributions are disturbed.
Sodium MRI
Most MRI methods target differences induced in water molecules, specifically hydrogen nuclei which consist of a single proton (1H), but conventional 1H-MRI is not the only possibility. Other nuclei can be targeted in MR images, and interest in doing so dates back to the earliest days of MRI development. Unfortunately, the physical properties of these ‘X-nuclei’ present additional challenges. Sodium is the most abundant nucleus after hydrogen in biological tissues possessing the ‘nuclear magnetic resonance property‘ (basically, odd numbered atomic mass) – but there’s ‘abundant’ and there’s ‘abundant’:

The image above represents a small portion of the inside of the cell. The small blue dots represent water molecules (H20). The little red dots represent ions, including sodium (but also potassium, magnesium, and calcium). Blue>>>>Red, clearly. MRI machines with stronger fields and specialised coils that go around your head inside of the MRI machine are (partial) technical fixes, but the fact remains that there is just less signal to work with when doing MRI with sodium.

One consequence of this is that there is a bit of confusion about what, exactly, we are measuring. MRI measures brain tissue parameters at much higher scale than the sub-cellular compartments that actually have specific, unique concentrations. Furthermore, MR images are made up of cube-like parcels called ‘voxels’ (=’pixel’ + ‘volume’). A voxel located at the border of two kinds of tissue will have a value that is actually a mix of the different compartments or tissues. This is a problem for normal MRI too, but is exacerbated with the reduction in signal in sodium MRI, which among other things leads to bigger voxels. This contributes to the problem of ‘partial volume’ effects. There are methods that might help correct for some of the bias introduced in this way – but that assumes we already know the ‘ground truth’ value we should correct to.
Brain sodium MRI – what is a good measurement?
Why should there be any confusion about the measurement of brain sodium? We can borrow concentration values and volumes for compartments in the cellular environment from microbiology and histology, and by combining them in our models we can get a pretty good idea of a reasonable general figure. But if we want to go further, and make models for specific tissues, or even regions within tissues, we find that the range of data we would need just doesn’t exist yet. It’s also not clear that these methods measure exactly the same things as MRI, so they can’t really be used as a one-to-one validation. There’s some great projects out there that are taking us in the right direction (eg, see the post below, with a book review thrown in), but for the moment we need a parallel approach.
Fortunately, sodium-based MRI has the useful feature that it can be calibrated. If you include a sample of sodium in known concentration in the scan alongside the head (see below) it is possible to use those to convert the arbitrary intensity of voxels into measurements with a concentration unit (millimolars, mM) on a common scale.
The common scale makes it easier to compare different estimates which, if different measurements of brain sodium by MRI are measuring the same thing, should tend to converge. ‘Tend to’ because variability is expected just for statistical reasons when you are trying to estimate a ‘true’ underlying value by combining limited, specific estimates from particular groups of participants in particular studies. This is addition to the variability induced by the use of different methods, which is particularly relevant in the context of Na-MRI where there isn’t a standardised approach. ‘Meta-analysis‘ is a statistical method for pooling estimates while (trying) to account for variability issues, and that’s what we did. The image below describes some of what we found. First we wanted to make sure we had as many relevant estimates to combine as possible, so we did a literature search. The top left chart (a) represents what we found, with the orange bars being the total numbers of potentially relevant studies for each year, red and blue referring to different sources of studies, and green being the studies we finally included in our meta-analysis. We included 28 studies out of a total 405 we considered, excluding the majority (including some of our own papers) for not being relevant for our question or not having quite the kind of estimate we needed.

In the top right chart (b), ‘COBIDAS‘ refers to a checklist that some researchers have proposed to make reporting in MRI studies more systematic, to help with things like comparability. Not all the items are relevant to Na-MRI, and this chart represents the areas from the checklist we thought appropriate. Green represents the number of papers in the 28 we included that did provided information on a given COBIDAS item, red the number that didn’t (again, including some of our own). In the bottom image, you can see all the specific sodium estimates we took from the various included studies, colour coded according to brain region. Not every paper used the same name for the regions or the same method for defining the region that was measured, so we had to make a consensus judgement call about which estimates were combined in which region. The criteria for inclusion, the COBIDAS domains to include and how to group the estimates are all choices. Others might make different choices, potentially leading to differences in conclusions, so we tried to be transparent as possible. The article is open access, and the text or the supplementary information details all our choices and the data extracted:
The article includes the pooled estimates for all the values that we found, and some pooled estimates for some sub-regions that had enough data points. However, we found that all these estimates had high heterogeneity – which means they were even more variable than expected given general statistical expectations (at least according to the meta-analytic model we used). Adding the anatomical sub-region that was sampled to the model reduced some of this heterogeneity, but not all. This means considering spatial and physiological variation when conducting experiments with 23Na-MRI is important, but not the end of the story. When we examined the effect of different methods on the pooled estimates, we could only look at the COBIDAS domains that are fully green, which was unfortunately fewer than we had hoped. Each domain included helped, but a lot of heterogeneity remained. This means our estimates can’t be considered definitive. But they do represent a starting point, and our analysis points to some straightforward steps for going further. Doing bigger studies with more people would be nice, but we could also expand data sharing, something that has already been done in other areas of MRI research. And we could, as a field, agree on reporting standards, so that there is more comparability among studies in future analyses.
References
[1] Ridley, B., Morsillo, F., Zaaraoui, W.. Nonino, F. Variability by region and method in human brain sodium concentrations estimated by 23Na magnetic resonance imaging: a meta-analysis. Sci Rep 13, 3222 (2023). https://doi.org/10.1038/s41598-023-30363-y
[2] Magistretti PJ, Allaman I. A cellular perspective on brain energy metabolism and functional imaging. Neuron. 2015 May 20;86(4):883-901. doi: 10.1016/j.neuron.2015.03.035. PMID: 25996133.
[3] Lang F. Mechanisms and significance of cell volume regulation. J Am Coll Nutr. 2007 Oct;26(5 Suppl):613S-623S. doi: 10.1080/07315724.2007.10719667. PMID: 17921474.
[4] Badawy RA, Harvey AS, Macdonell RA. Cortical hyperexcitability and epileptogenesis: understanding the mechanisms of epilepsy – part 1. J Clin Neurosci. 2009 Mar;16(3):355-65. doi: 10.1016/j.jocn.2008.08.026. Epub 2009 Jan 4. PMID: 19124246.
[5] Raichle ME & Mintun MA. Brain work and brain imaging. Annu Rev Neurosci. 2006;29:449-76.
[6] David S. Goodsell. The Machinery of Life. 2nd edn., 2009, Springer-Verlag, London. ISBN: 978-0-387-84924-9
[7] Tohka J. Partial volume effect modeling for segmentation and tissue classification of brain magnetic resonance images: A review. World J Radiol. 2014 Nov 28;6(11):855-64. doi: 10.4329/wjr.v6.i11.855. PMID: 25431640; PMCID: PMC4241492.